

WiFi Site Surveys and Wireless Heat Map Design in Pennsylvania
KIT Communications runs commercial WiFi site surveys and wireless site surveys across central and eastern Pennsylvania from our Lebanon headquarters. A survey is the engineering work that decides where access points go, how many a building actually needs, and how the wireless network will perform once it's live — before any hardware is bought or mounted. KIT delivers WiFi heat maps and a written engineering report on every survey, whether the project is a new enterprise WiFi installation, an expansion, or a diagnosis of a network that isn't performing.
KIT scopes three survey types to the building and the question being answered: a predictive survey modeled in software, a live survey (AP on a Stick) measured on-site, and a post-deployment survey that measures an installed network under real conditions. The right one depends on the facility, the timeline, and what the data is for.
KIT surveys across all current WiFi bands — 2.4 GHz, 5 GHz, and the 6 GHz band introduced with WiFi 6E and carried forward by WiFi 7. The 6 GHz band delivers more capacity but has shorter range and more wall attenuation. KIT's survey equipment measures all three bands, so a WiFi 6, 6E, or WiFi 7 design is validated against the real building.
The Three Types of WiFi Survey

The survey type drives the cost and the accuracy. KIT picks the one that fits the project.
- Predictive site survey. Modeled in software from the facility's floor plan and wall construction. Lower cost, faster, no on-site survey day. Accurate enough for most offices, schools, and new construction where the layout and materials are known. This is the right starting point for the majority of projects.
- Live site survey (AP on a Stick). A real access point is placed and walked through the building to measure actual signal room by room. The right call where RF behavior can't be predicted from drawings — older buildings with unknown wall materials, warehouses with shifting metal inventory, or healthcare spaces dense with equipment. More on-site time, higher cost, measured certainty.
- Post-deployment survey. Measures an installed network as it actually runs — signal, throughput, roaming, and coverage under live client load. Used to validate a new install against its design, to troubleshoot complaints on an existing network, or to baseline coverage before a planned upgrade.
What a WiFi Heat Map Reports
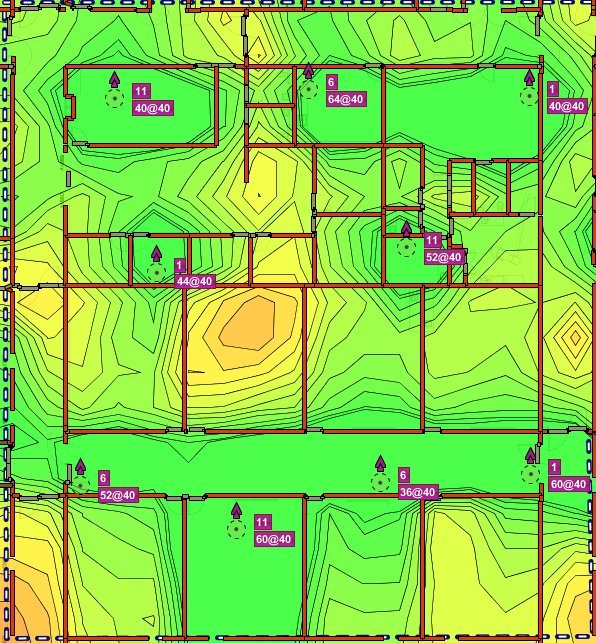
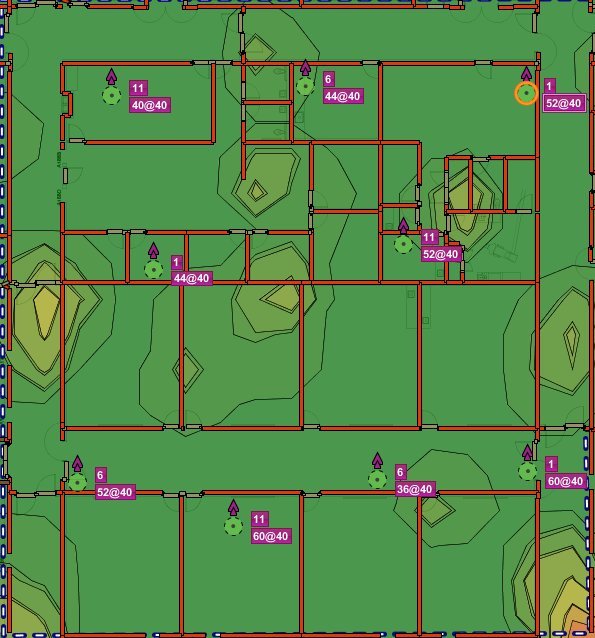
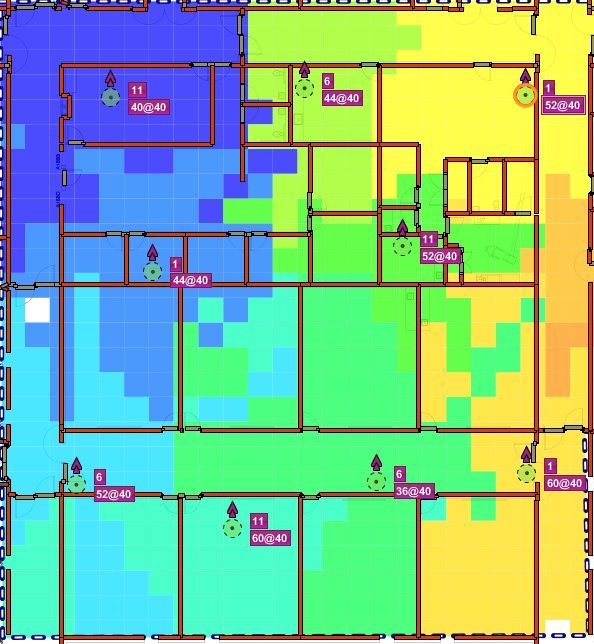
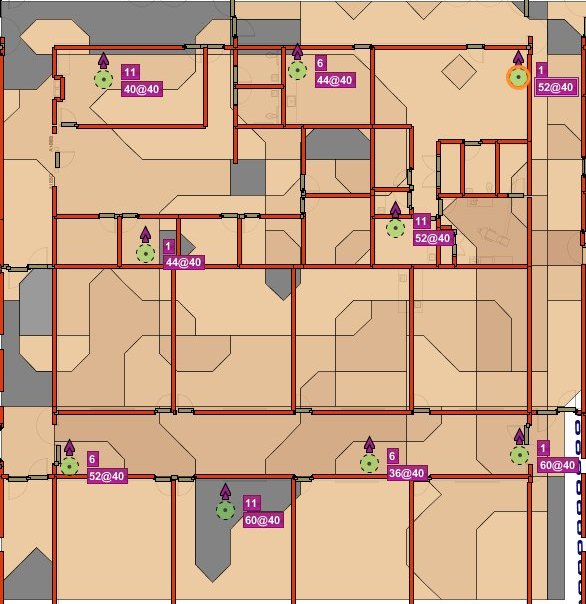
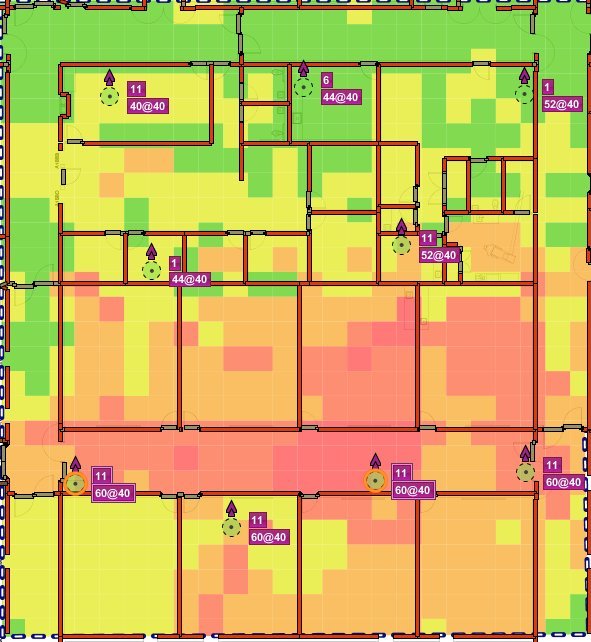
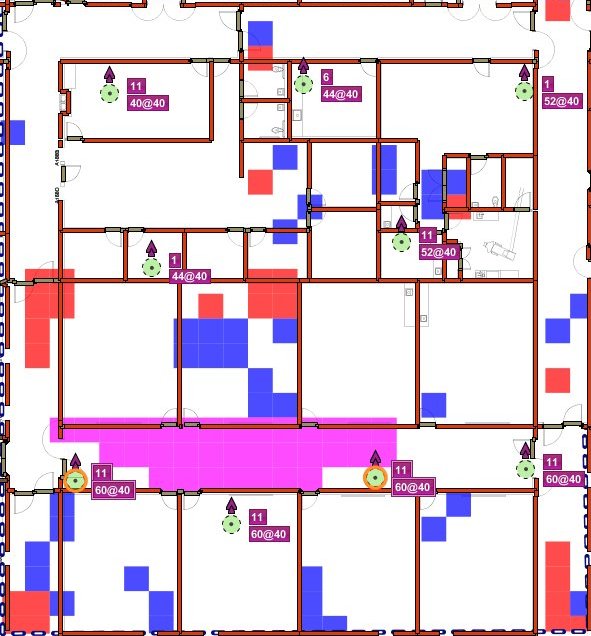
A WiFi heat map is a color-coded floor plan of how the wireless network performs across the space. A KIT survey report goes past a single coverage picture — it isolates the specific factors that decide whether users get a fast, stable connection, so the design can be proven against the building or an existing network's weak spots located precisely.
WiFi Troubleshooting and RF Spectrum Analysis
When an existing network is slow, dropping connections, or failing in one part of a building, a post-deployment survey measures what's actually happening and a WiFi coverage map shows where it breaks down. Coverage gaps, capacity saturation in high-density areas, and bad roaming behavior each leave a distinct signature in the data.
Where the cause is outside interference rather than coverage — another system putting noise into the same frequencies — KIT runs an RF spectrum analysis to detect and measure non-WiFi noise sources. That distinction matters: KIT diagnoses interference before adding access points. The wireless network assessment identifies the real cause and the report states the fix.
Start a WiFi Site Survey
Call or email our Sales team to start.
Where WiFi Surveys Earn Their Cost
Distribution centers and warehouses. Long sight lines, dense metal racking, mobile devices roaming across the floor, and high concurrent device counts in pick/pack areas make warehouse RF impossible to predict from drawings alone. A live survey measures it. KIT serves logistics operations along the I-81 and I-78 corridors from Carlisle through Harrisburg to the Lehigh Valley.
K-12 schools and districts. 1:1 device programs put a high, simultaneous client load in every classroom. For districts from Lancaster to York, a survey sizes access point density for that load and validates coverage before a district commits its budget. Procurement is available through PEPPM and COSTARS.
Healthcare and senior living. Clinical WiFi carries electronic health records, medical device connectivity, and real-time location services, and the buildings are dense with equipment that affects RF. Measured surveys keep clinical coverage honest.
Offices and multi-tenant buildings. Conference-room density, tenant-specific networks, and changing floor layouts are the usual survey drivers. Predictive modeling handles most office work; a post-deployment survey settles complaints when they come up.
Why KIT for WiFi Surveys
The survey type fits the project. KIT matches predictive, live, or post-deployment to the building and the question. The deliverable is a written engineering report with the heat maps.
The survey connects to the install. KIT designs and installs commercial WiFi networks across the enterprise wireless platforms it deploys, and runs the structured cabling that feeds the access points. KIT carries the survey through to a working network.
Serving Pennsylvania businesses since 1999. KIT is a Pennsylvania low voltage contractor headquartered in Lebanon — in business since 1999, with 3,400+ projects completed since 2020 alone. KIT holds COSTARS, PEPPM, and TIPS cooperative purchasing contracts for government and school work.
Frequently Asked Questions
It's the engineering analysis that determines where access points go, how many a facility needs, and how the wireless network will perform. KIT runs predictive (software-modeled), live (AP on a Stick, on-site measured), and post-deployment (measures an installed network) surveys. The deliverable is a written report with WiFi heat maps.
A predictive survey is modeled in software from the floor plan and wall construction — lower cost, faster, accurate for most offices and new construction. A live survey (AP on a Stick) places a real access point and measures actual signal room by room, which matters where RF can't be predicted from drawings — older buildings, warehouses with metal racking, equipment-dense healthcare spaces. KIT scopes the type to the building.
A color-coded floor plan of wireless coverage and performance. KIT's reports cover signal strength, signal-to-noise ratio, expected throughput, access point cell coverage, roaming handoff zones, and co-channel interference — so a design can be validated against the building, or an existing network's weak spots located precisely.
Yes. A post-deployment survey measures the installed network under real conditions to locate where performance fails. KIT runs RF spectrum analysis to detect and measure non-WiFi noise. The report identifies the cause and the fix.
A survey is what separates an engineered network from a guess. For a new install, it sets access point count and placement before hardware is purchased — avoiding both dead zones and paying for access points the building doesn't need. For an expansion or a network with complaints, it measures what's actually happening before changes are made.
Central and eastern Pennsylvania from our Lebanon headquarters — Lancaster, Harrisburg, Lebanon, York, Reading, Allentown, Bethlehem, Easton, Carlisle, Chambersburg, Hershey, and Hanover.